Loading... ## 第一步、分析页面 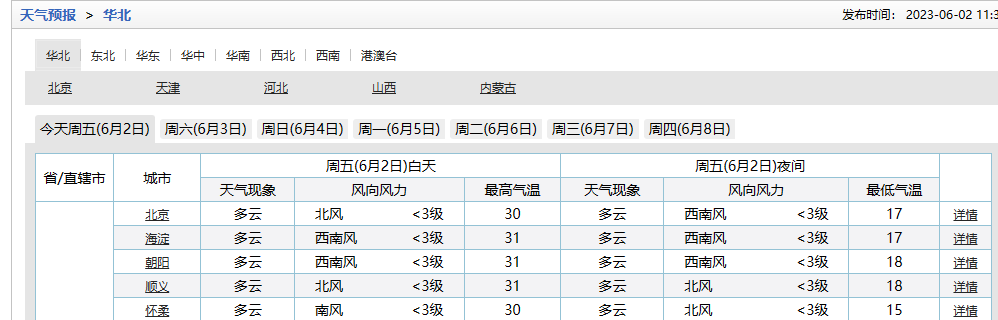 F12打开分析页面源码,废话不多说 ## 第二部、写代码 ```python # -*- codeing = utf-8 -*- # @Time : 2023/5/31 18:39 # @Author : 乙太 # @File : 中国最低气温排行榜.py # @Software : PyCharm import requests from bs4 import BeautifulSoup from pyecharts.charts import Bar from pyecharts import options as opts import os ALL_DATA = [] class TianQi: def __init__(self): self.headers = { 'User-Agent': 'Mozilla/5.0 (Windows NT 10.0; Win64; x64) AppleWebKit/537.36 (KHTML, like Gecko) Chrome/113.0.0.0 Safari/537.36 Edg/113.0.1774.57', 'Accept': 'text/html,application/xhtml+xml,application/xml;q=0.9,image/webp,image/apng,*/*;q=0.8,application/signed-exchange;v=b3;q=0.7', 'Cookie': 'HttpOnly; HttpOnly; userNewsPort0=1; defaultCty=101030100; f_city=%E5%A4%A9%E6%B4%A5%7C101030100%7C; defaultCtyName=%u5929%u6D25; zs=101030100%7C%7C%7Cyd-uv' } def parse_page(self, url): response = requests.get(url, headers=self.headers) text = response.content.decode('utf-8') soup = BeautifulSoup(text, 'html5lib') conMidtab = soup.find('div', class_='conMidtab') conMidtab2s = conMidtab.find_all('div', class_='conMidtab2') if url == 'http://www.weather.com.cn/textFC/gat.shtml': conMidtab2s = soup.find('div', class_='conMidtab2') tbodys = conMidtab2s.find_all('tbody') conMidtab2s = tbodys for conMidtab2 in conMidtab2s: trs = conMidtab2.find_all('tr')[2:] for index, tr in enumerate(trs): tds = tr.find_all('td') city_td = tds[0] if index == 0: city_td = tds[1] city = list(city_td.stripped_strings)[0] temp_td = tds[-2] min_temp = list(temp_td.stripped_strings)[0] ALL_DATA.append({"city": city, "min_temp": int(min_temp)}) # print({"city": city, "min_temp": int(min_temp)}) def main(self): self.urls = [ 'http://www.weather.com.cn/textFC/hb.shtml', 'http://www.weather.com.cn/textFC/db.shtml', 'http://www.weather.com.cn/textFC/hd.shtml', 'http://www.weather.com.cn/textFC/hz.shtml', 'http://www.weather.com.cn/textFC/hn.shtml', 'http://www.weather.com.cn/textFC/xb.shtml', 'http://www.weather.com.cn/textFC/xn.shtml', 'http://www.weather.com.cn/textFC/gat.shtml' ] for url in self.urls: self.parse_page(url) print(url, '+' * 40) # 分析数据 # 根据最低气温进行排序 ALL_DATA.sort(key=lambda data: data['min_temp']) # lambda匿名函数,非常重要;然后从低到高排序 data = ALL_DATA[0:10] print(data) # 数据可视化pyecharts bar = Bar() bar.set_global_opts(title_opts=opts.TitleOpts(title="中国最低气温排行榜")) ''' for city_temp in data: city = city_temp['city'] cities.append(city) ''' cites = list(map(lambda x: x['city'], data)) temps = list(map(lambda x: x['min_temp'], data)) bar.add_xaxis(cites) bar.add_yaxis("城市",temps) bar.render('temperature.html') os.system('temperature.html') if __name__ == '__main__': TQ = TianQi() TQ.main() ``` 最后:实现效果 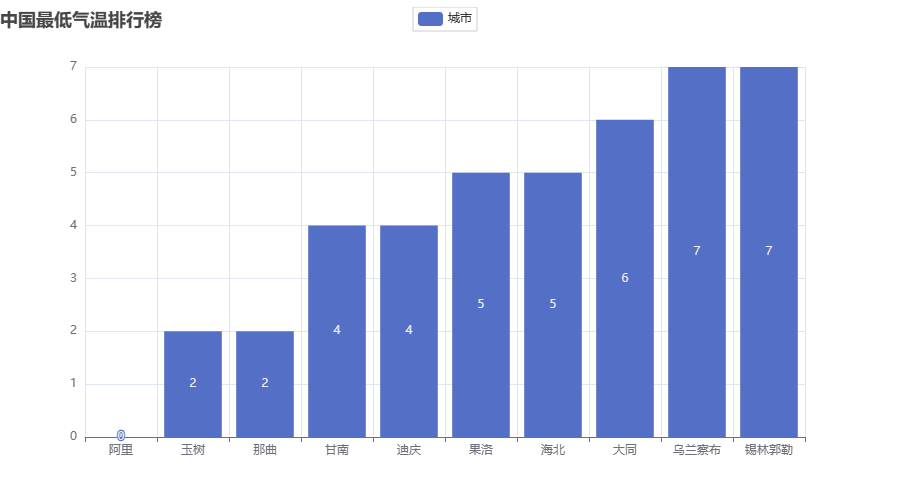 最后修改:2023 年 06 月 02 日 © 允许规范转载 打赏 赞赏作者 支付宝微信 赞 9 如果觉得我的文章对你有用,请随意赞赏
